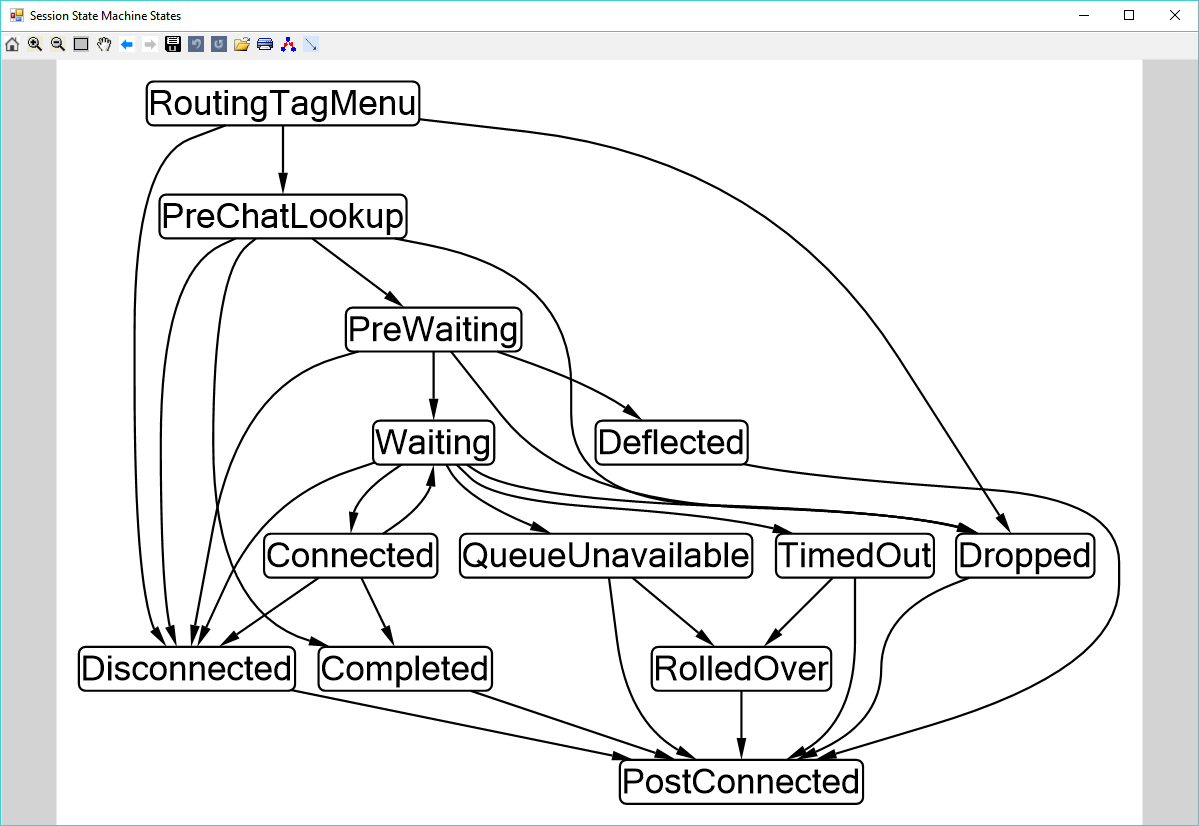
TLDR; the Microsoft Automatic Graph Layout library is pretty slick at automatically generating state transition diagrams.
One of the products that I work on for my day job is an instant message-based call center/helpdesk application. It's a pretty complicated beast, but at the heart of it, what it does is:
- Allow users to contact a central endpoint.
- Process the incoming request
- Route the request to a member of a predefined group that can assist the end-user
- Broker the conversation between the end-user and the helpdesk/call center agent.
- Perform post-processing on the chat session once it has ended.
This state machine started out fairly simple, with just a few states, but as always happens, we began to accrete features, and so more and more stages were added into the pipeline, and the complexity and number of state transitions grew. The state machine definition that originated as a hastily drawn scrawling on a sheet of printer paper blossomed into a Visio diagram, then eventually wilted into irrelevance as more and more states were added and documentation efforts fell behind. Like most manual processes, it became a pain point, and was neglected.
Things came to a head recently when it was discovered that a state transition had been added as a code path in certain situations, but the state machine transition table had not been updated accordingly, and so it was possible for chats to attempt to make a transition that the state machine would reject as invalid, leaving the chat session in limbo. Not ideal. Ideally, we'd have caught this in some way with compile or build-time static analysis, but getting that implemented is going to have to be an exercise for the future. Failing that, exhaustive unit-tests validating the state transition rules was the easier task, but ran into the difficulty that the hand-written design documentation had fallen out of date, which necessitated a tedious and time-consuming search through the code base to trace out the logic. Once that was complete, there remained the task of updating the Visio docs... which is less than fun to do by hand.
Earlier that week, I had run across a link to the Microsoft Automatic Graph Layout library, a nifty open-source project that makes it stupidly easy to define a graph and then either display it in a Windows Form or render to an image file. While it may not be quite as nice looking as a hand-crafted Visio doc, it's not too unattractive, and better, can be completely automated. So we can just pipe our state transition definitions into it from the source code, and right out comes a legible diagram. We can even run it as a post-build step in our build to automatically keep the documentation up-to-date. Hooray!

