
Voronoi Diagrams
A little over two years ago, I first saw Amit Patel's article on Polygonal Map Generation, and thought it was incredibly cool. The use of Voronoi regions created a very nice, slightly irregular look, compared to grid-based terrains. At the time, I had just finished up working on my DX11 random terrain code, and it looked like a fun project to try to tackle.
I then proceeded to spend several months messing around with different implementations of Fortune's Algorithm in C# to get started and generate the Voronoi polygons used to generate a terrain along the lines of Amit's example. At this point, I've lost track of all of the different versions that I've sort of melded together to produce the code that I've ended up with in the end, but some of the more influential are:
- The original implementation of the algorithm by Steve Fortune
- This JS version by Nicolas Garcia Belmonte
- This C++ version, which is a port of the ActionScript version used in the original Amit Patel map generator.
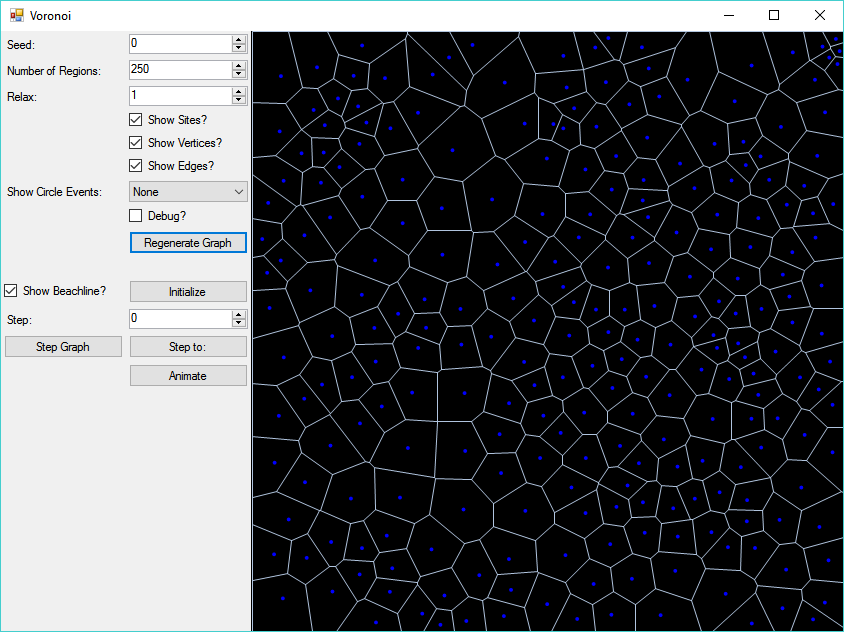
The original goal was to create a map generator, suitable for a kind of overworld/strategic level map. But, alas, life happened, and I got bogged down before I got that far. I did, however, wind up with a fairly cool tool for generating Voronoi diagrams. Because I had spent so much time trying to iron out bugs in my implementation of the algorithm, I ended up producing a WinForms application that allows you to step through the algorithm one iteration at a time, visualizing the sites that are added to the diagram, the vertices and edges, as well as the position of the beach and sweep lines. Eventually I also worked in options to show the circles through three sites that define where a Voronoi vertex is located, as well as the Delauney triangulation of the sites.
I won't pretend that this code is fantastic, but it's kind of interesting, and I worked at it for quite a while, so better to have it out here than moldering on a hard drive somewhere. If you'd like to see the source, it is available on GitHub. You can also download the executable below if you like - I make no promises that it will work everywhere, but it is a pretty standard .Net 4.5 Windows Forms application. I've also got some videos below the fold, if you'd like to see this in action.
Download VoronoiVoronoi diagram with 50 sites
Here you can see the algorithm at work, first animated, then stepped through step-by-step. The sweep line is shown in purple, each step progressing down the graph, adding one site at a time. The beach line is the orange curve, consisting of parabola segments. Each segment of the beach line is an arc where the distance between the nearest point and the sweep line is equal. Each site that is added to the diagram is one of the blue dots - when a new site is added, it is initially show larger, and in a lighter cyan blue. The red dots that appear are the Voronoi vertices - the points that are at the center of a circle drawn through the three nearest sites. The white edges are then connected between these vertices.
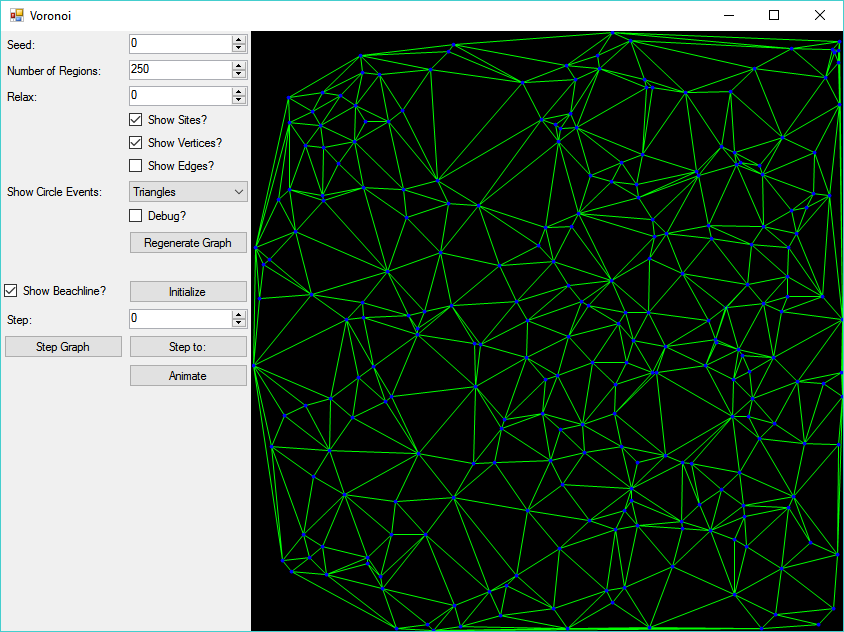
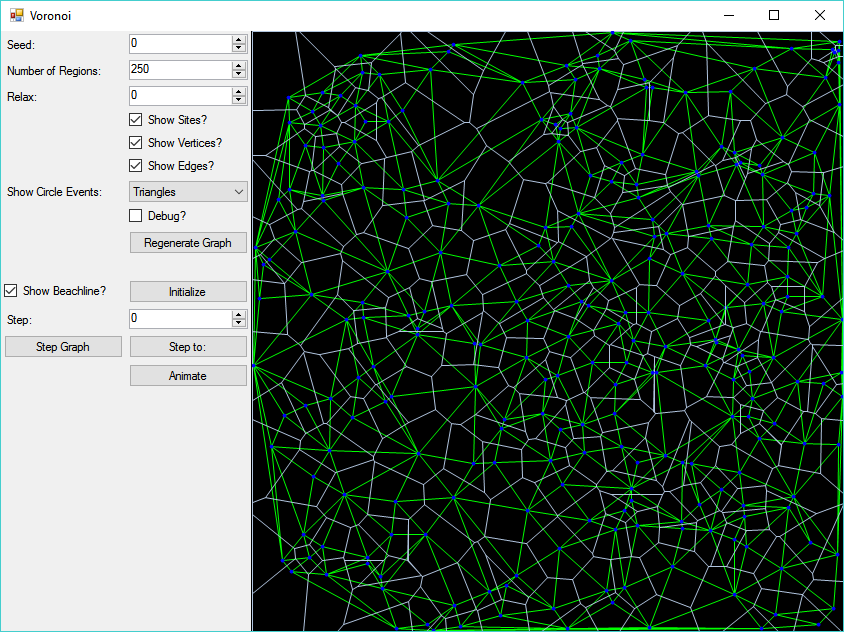
Circle events and Delauney Triangulation
This video shows how, when a new vertex is added to the Voronoi diagram, a circle is formed intersecting the three nearest sites, shown initially in yellow. At the end, you can also see the Delauney Triangulation, with is the dual graph to the Voronoi diagram.
Lloyd's Relaxation to Regularize the Polygons
One more advanced feature that I did get to implementing from the polygonal map generator was the idea of relaxing the points to generate more regular polygons. This is done by first creating a Voronoi diagram with the original set of sites, then creating a new list of sites by taking the centroids of the Voronoi polygons, and using that set of points to again create a Voronoi diagram. Any number of iterations of this process can be performed, but one or two cycles is usually enough to smooth out any severe irregularities, without reducing the initial random points down into a boring grid or hexes.
5000 to 10000 Site Diagrams
You can generate some pretty interesting diagrams using large numbers of sites - here you can see diagrams generated with between five thousand and ten thousand points. It's actually pretty snappy, too, so long as you aren't trying to use the automatic animation feature - it is after all, rendering using some pretty basic, unoptimized GDI, and drawing the parabolas for the beach line, in particular, are complex.